Neurophysiological correlates for dynamic variability between vigilance and avoidance in test anxiety
Cenlou Hu, Xueling Song, Jintao Song, Yan Hong, Renlai Zhou
Attention bias (ABs) to threat is essential in the etiology and maintenance of test anxiety. However, little is known about the attention pattern of ABs in test anxiety. The stimulus duration affects the attention pattern in anxiety. Thus, the present research combined the dot-probe paradigm and event-related potentials (ERPs) and varied the stimulus duration (100ms or 500ms) to test the ABs in test anxiety. Consequently, both groups showed a threat N2pc in 100ms and 500ms duration, suggesting that both groups allocated attention to the test-related threat. However, in the 100ms duration, the high test-anxious (HTA) group had smaller target-elicited P1 and greater target-elicited N2 in the threat-congruent condition than in the neutral condition. In the 500ms duration, an earlier threat N2pc and a threat PD followed a greater target P1, and smaller target N2 were pronounced in the HTA group. The current results provided electrophysiological evidence that the HTA group kept a dynamic attention pattern that fluctuated shift between vigilance and avoidance in the 100ms and 500ms duration. The HTA group was more vigilant than the LTA group in the 500ms duration when strategic attention was concerned, proposing that the vigilance in test anxiety was not an automatic process.
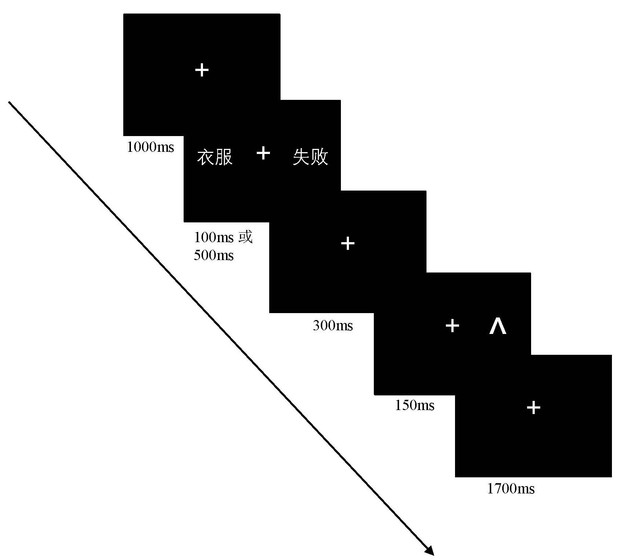
Fig.1 Example of the flow of events on trial.
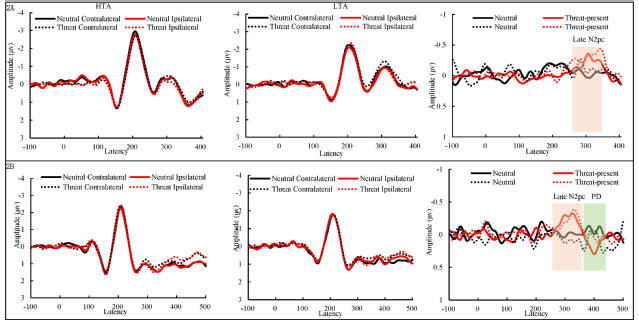
Fig2 shows the event-related potentials elicited by the cue display.
Fig. 2A shows the grand-averaged event-related potential waveforms recorded contralaterally and ipsilaterally to the threat cue for the 100ms duration. Fig. 2B shows the grand-averaged event-related potential waveforms recorded contralaterally and ipsilaterally to threat cue for the 500ms duration. The left figure shows the grand-averaged event-related potential waveforms for the HTA group. The middle figure shows the grand-averaged event-related potential waveforms for the LTA group. The right figure shows the contralateral-minus-ipsilateral (Contra-Ipsi) difference waveforms of the cue display (The full line shows the difference waveforms of the HTA group, and the dotted line shows the difference waveforms of the LTA group).
Note: HTA represents high test anxiety; LTA represents low test anxiety.
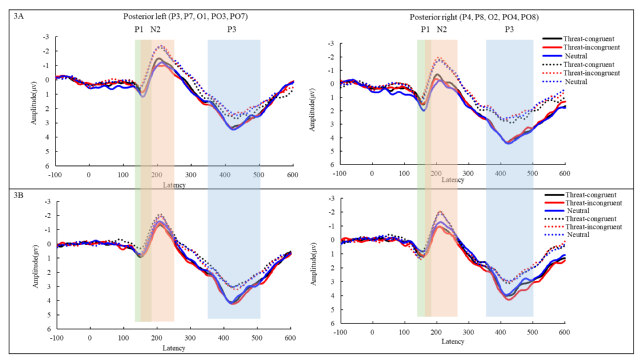
Fig3 shows the event-related potentials elicited by the target display.
Fig. 3A shows the grand-averaged event-related potential waveforms of the target for the 100ms duration. Fig. 3B shows the grand-averaged event-related potential waveforms of the target for the 500ms duration. The left figure shows the posterior left (P3, P7, O1, PO3, PO7) grand-averaged event-related potential waveforms of the target. The right figure shows the posterior right (P4, P8, O2, PO4, PO8) grand-averaged event-related potential waveforms of the target. The full line shows the grand-averaged event-related potential waveforms of the HTA group, the dotted line shows the grand-averaged event-related potential waveforms of the LTA group.
Note: HTA represents high test anxiety; LTA represents low test anxiety.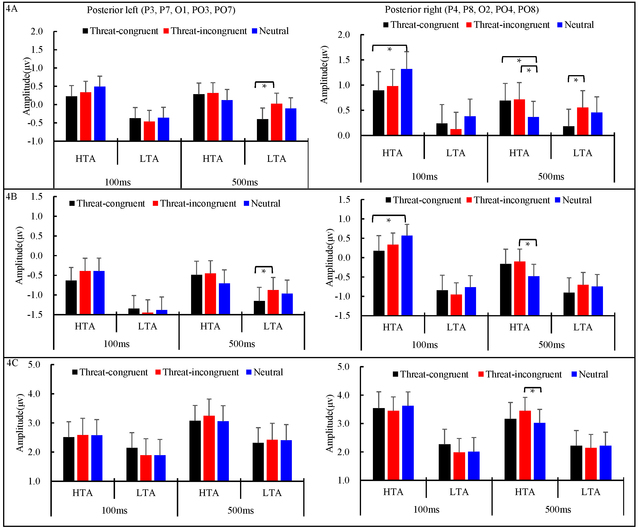
Fig.4 shows the mean values of the target elicited event-related potential waveforms.
Fig. 4A shows themean values of the target P1 (140-190ms) amplitude. Fig. 4B shows themean values of the target N2 (150-250ms) amplitude. Fig. 4C shows themean values of the target P3 (350-500ms) amplitude. The left figure shows the posterior left (P3, P7, O1, PO3, PO7) grand-averaged event-related potential waveforms of the target. The right figure shows the posterior right (P4, P8, O2, PO4, PO8) grand-averaged event-related potential waveforms of the target.
Note: HTA represents high test anxiety; LTA represents low test anxiety.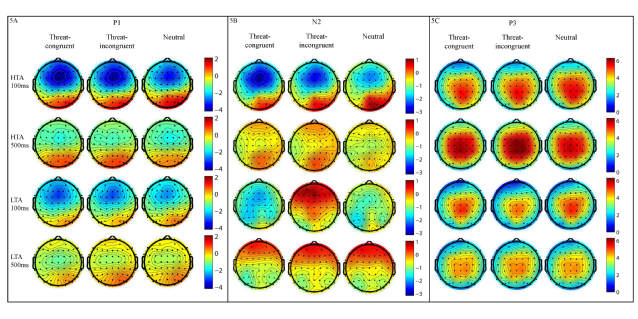
ig.5 shows the topography of the target elicited event-related potential waveforms.
Fig. 5A shows thetopography of the target P1 (140-190ms) amplitude. Fig. 5B shows thetopography of the target N2 (150-250ms) amplitude. Fig. 5C shows thetopography of the target P3 (300-350ms) amplitude.
Note: HTA represents high test anxiety; LTA represents low test anxiety. Neurophysiological correlates for dynamic variability between vigilance and avoidance in test anxiety.pdf
